The CTR Yield Curve is not a new concept, but it became more important with the load of modules that Google released within its SERPs during the last years.
It is often an overlooked factor during the keyword research process for existing categories and is, in my opinion, critical to really assess the traffic you can get and not only look at search volume.
In this article, I will walk you through the definition of the concept, why it matters more than ever and how you can apply it to your SEO strategy to really focus your effort on the content that can bring more traffic.
What the heck is a CTR Yield curve?
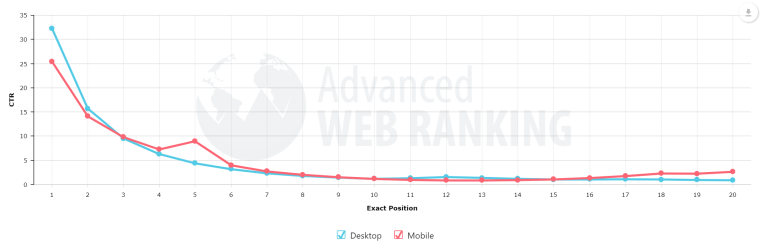
If you are working in SEO, you already know what a yield curve is, you may just not be aware of that yet. I’m sure that you you’ve seen this kind of graph at some point in your career:
Source:https://www.advancedwebranking.com/ctrstudy/
There are a lot of different studies on this subject, but the reality is that your CTR always depends on your position. It is true since the beginning of Google and it still stands today.
Well, guess what? This is a yield curve, showing the relation between the position and the CTR. This relation is always negative: the higher (which actually means lower in term of SERP) your position is, the lower your CTR will be.
Why does it matter?
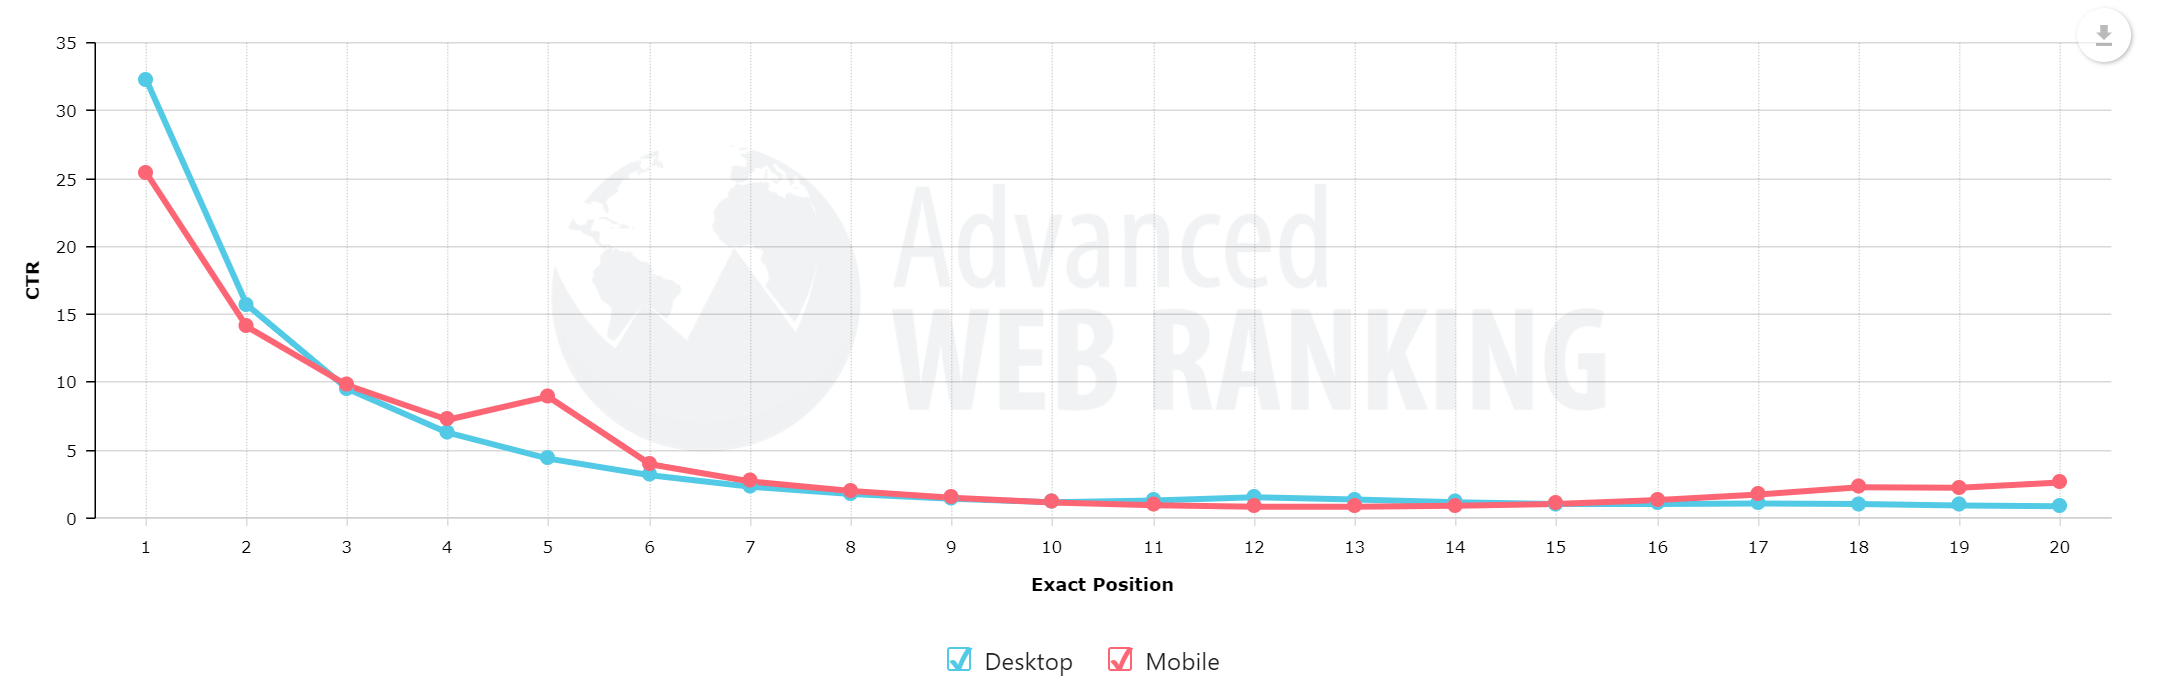
Let’s go back some years ago. If you were to search something on Google, you would observe a web page like the following:
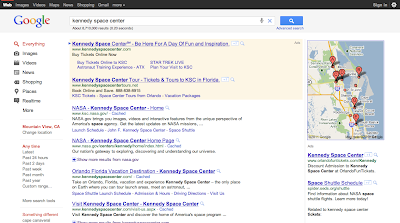
Source: Google Search Blog
The famous ten blue links with some additional information on the left, on the right and at the top, but a good CTR for the first organic results anyway. If you perform the same search today, the amount of information included in the search result page by Google is higher. In some cases, you have to scroll more than 1000px to get to the first organic results. When Jumpshot’s data were still available, zero-clicks searches were on the rise and I doubt that this trend is likely to have been reversed since then.
This new reality happened for several reasons but mainly because Google shifted its strategy from a search engine to an answer engine. Nevertheless, depending on the industry you are working in, you may still have some clean SERPs for some of your queries and this is where the CTR yield curve will be important.
Let’s imagine that you are working as a SEO for a company offering two services:
- Travel packages
- Flight tickets
You are perfectly aware of the CTR yield curve concept, and you know that in flight related queries, Google promotes its own solution, Google Flights, and the competition is fierce. **Hence, you may expect a lower CTR for the first organic results than in the travel packages vertical, where Google doesn’t yet promote its own solution. **

Some years ago, if you had to prioritize one of these two verticals, you would have taken into account search volume and business metrics like margins etc… to decide which one to choose. Now, you have to take into account the CTR yield curve for your vertical, as the CTR for any given industry can differ a lot.
How can you do that? In the following section, I will walk you through the full process.
How to calculate the CTR yield curve for your vertical
To realize this analysis, you will need an access to a Google Search Account for a website that is already ranking, at least in some extent, in your verticals. Indeed, no external study provide trustworthy CTR data, and you will have to use yours.
What we will do is to basically create a table estimating the CTR per position for our verticals, based on our data.
Tools
Ok, so let’s start with the tools you need. You have several option:
- Use this extension for Google Sheets to retrieve your Google Search Console data directly in Google Sheets. Handy if you have a small to medium website or if you have a powerful computer. Please note that for big websites, the data extraction can take a while.
- Use Supermetrics, which is a great tool to extract your data from third-parties. It costs 99$ per month, but it’s really worth the investment if you want to automate your reporting.
- Use whatever programming language your are more comfortable with to query directly the API. I personally use Python, but you can achieve the same with R, Java, PHP etc…
What really matters here is the process, the way of getting there is really a matter of personal preference.
Filter your GSC data
The first step is to filter your GSC data to match the vertical you want to analyze. If we stick to our previous example, let’s imagine that:
- The flight content is located in the /flights folder
- The travel packages content is located in the /travel folder
Using GSC filters, you can filter URLs by specific patterns. I would also suggest to filter out URLs where the average position is higher than 10, since our objective is to analyze the CTR for exclusively the first page.
You should retrieve your data day by day. Why day by day? Your rankings can change significantly during a month, so sticking with the average ranking shown by GSC for a full month is not reliable enough. We need more granularity.
At this stage, you should end up with a table similar to the following:
| Date | URL | Impressions | Clicks | Avg. Position |
|---|---|---|---|---|
| 15/01/2020 | https://www.mywebsite.com/flights/france | 100.000 | 2.000 | 2.3 |
| 15/01/2020 | https://www.mywebsite.com/flights/spain | 365.000 | 10.000 | 5.8 |
| 16/01/2020 | https://www.mywebsite.com/flights/greece | 500.000 | 50.000 | 1.2 |
Easy? Yes, but not so fast. If we just filter using this methodology, we are left with several major flaws:
- Branded and non-branded terms usually have huge differences in CTR. Hence, you should filter you data to exclude branded keywords as they can skew you analysis.
- URLs can show up as sitelinks on some generic queries, messing with the CTR we will calculate. We should exclude these cases as well. This one is exactly tricky to spot because a generic query doesn’t have a specific pattern, but you will have to go through the process if you don’t want to get a skewed analysis.

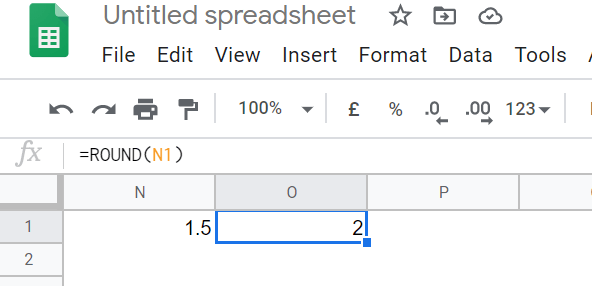
Round the average position
With the data you have at this stage, you should observe that the average position is decimal, which is not something we want to keep as a decimal position doesn’t really mean anything. This happens because you may rank 1st for an user and 2nd for another one, hence the average ranking is 1.5.
**We’ll just round the average position column by applying a simple ROUND() function in Excel or Sheets. **
Create the final analysis
At this stage, you should be able to create a Pivot Table with:
- Index: Position
- Values: Sum of Impressions / Sum of Clicks
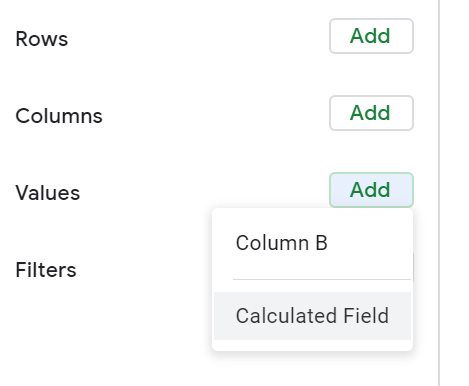
Then add a calculated field to manually compute the CTR. I honestly don’t know how to add it in Excel, but in Google Sheets you can do it directly using the dropdown from the “Values” section.
Define your priority
Now that you have obtained the CTR Yield Curve using your data, you can take that information into account to prioritize your different verticals. Let’s walk you through it.
In a classical situation, you would prioritize your sections based on the competition, the demand, which in SEO is basically the search volume, and business metrics like margins. So if all other things are being equal, you would basically prioritize the vertical where the search volume is higher. You do the keyword research and you estimate that the global demand for travel packages is 100.000 per month and 150.000 per flights, hence you would argue that if you want to grow your business, the flights section must be prioritized.
Ok, now if you run the analysis we just detailed, imagine that you end up with the following CTR data for your verticals:
Flights
| Position | CTR |
|---|---|
| 1 | 20.32% |
| 2 | 8.92% |
| 3 | 5.22% |
| 4 | 3.32% |
| 5 | 1.08% |
| 6 | 1% |
| 7 | 0.76% |
| 8 | 0.32% |
| 9 | 0.18% |
| 10 | 0.07% |
Travel packages
| Position | CTR |
|---|---|
| 1 | 32.32% |
| 2 | 15.92% |
| 3 | 10.22% |
| 4 | 7.32% |
| 5 | 4.08% |
| 6 | 2.76% |
| 7 | 1.76% |
| 8 | 1.54% |
| 9 | 0.87% |
| 10 | 0.47% |
Well, the conclusion would not be the same. Indeed, even if the travel packages market is smaller, the amount of traffic you can actually get to your website is higher. From a traffic and a business perspective, this is actually the vertical that you must focus on, despite having less search volume than the other.
Even if this analysis is not complex, I think it can yield (!) huge benefits and shift completely your priorities. Don’t ignore that the main competitor you have in the SERP is Google itself when it displays modules like this and define your priorities based on your data and the real traffic potential, not the search volume.