
Unless you’ve been living under a rock for a couple of months already, you know that Google has replaced Universal Analytics by its new measurement solution, Google Analytics 4. While I believe this change is a step back for small businesses that don’t have the time or money to understand how the tool works, the product is actually better for professional marketers if you know how to use it.
But you shouldn’t even try to use the UI for reporting purposes because it is simply awful. Looker Studio or any other visualization tool would do a better job.
Nevertheless, if you use the data from the API and you have a lot of data, you may face countless issues. For instance, if I request the views per hostname here, I get around 70% grouped within the (other) group, which doesn’t make any sense.
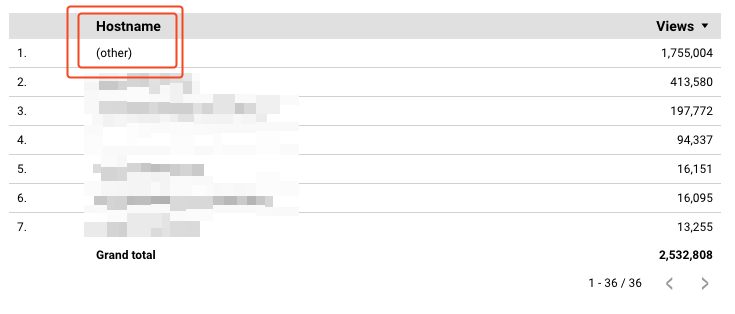
This creates plenty of inconsistencies in your reporting and undermines the trust you have in your data. And if there is one thing that is worse than no data, it is bad data!
To overcome this effect, there is a “free” (I’ll explain that later) connector between Google Analytics 4 and BigQuery, the cloud warehouse solution from Google. In this article, I’ll explain how to set it up and use it from scratch.
Why should I use the connector?
I already mentioned one of the main reason you’d want to activate this connector, but let me be more explicit here.
- Get access to unsampled event data: this should come by default with the API but this is not the case. If you want to trust you data in GA4, you need to use the connector.
- Work retroactively: this is maybe one of the most frustrating things about Google Analytics. If you spot an issue, there is no way to fixing it retroactively (exception: modify an event name). By having raw data at your disposal, you now can,
- Merge GA4 data with other sources: As SEO professionals, we need to work with several data sources, such as Google Analytics but also Google Search Console or business data. By having raw data in BigQuery, we can create a data pipeline and having everything at the same place.
How to set up the connection?
The process is easy, and you don’t need any advanced technical knowledge to do it.
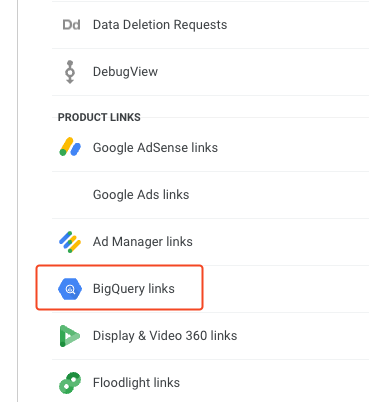
- Go to the Admin section of your GA4 property and click on the BigQuery links element.
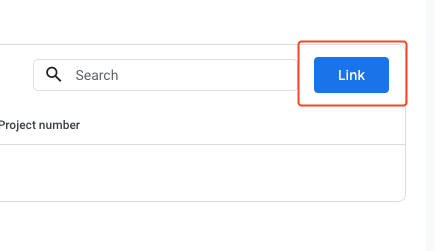
- Then, click on the Link button at the top-right hand corner
- Choose the BigQuery project you’d like to use for the export. If you don’t know what I’m talking about or don’t have one yet, this guide should help you. Please note that if you are using your professional e-mail, you may have to ask the administrator to do it for you because you won’t have the rights.
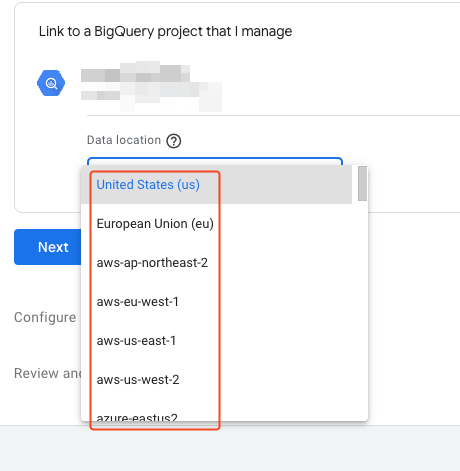
- Select the location you’d like your data to be stored in. Remember that under GDPR, all data collected on EU citizens must be either stored in the EU or within a jurisdiction that has similar levels of protection, so choose wisely if you fall under GDPR.
- Configure the data that you want to include in your export. My recommendations:
- Export type: Daily is enough for most cases
- User data: often not needed
- Choose carefully the events you wish to exclude. For instance, the scroll event is often useless for reporting purposes and often represent a huge part of what would be exported.
- Review and validate the connection. If you go to BigQuery you should now see a new dataset that will be receiving your daily from now on.
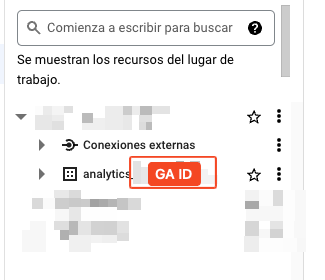
Every day (around noon), GA4 will create a table in this dataset with the past day data. The sad things is that the connector is not retroactive: if you activate it today, you won’t have you past data.
What about the cost?
This is the tricky one. As I explained, the connector is free, but BigQuery isn’t. The pricing model can be quite hard to grasp the first time, so let me explain it in plain English.
In BigQuery, you are charged for two things:
- Storage: €0.02 / GB / month with 10GB free / month. It means that if you have 50GB stored, you’ll be charged 40GB, hence €0.8.
To understand the amount of data you’ll be receiving, you can select a table you received from GA4, click on details and head to the storage info section. In this example, my export is generating around 230 MB per day.
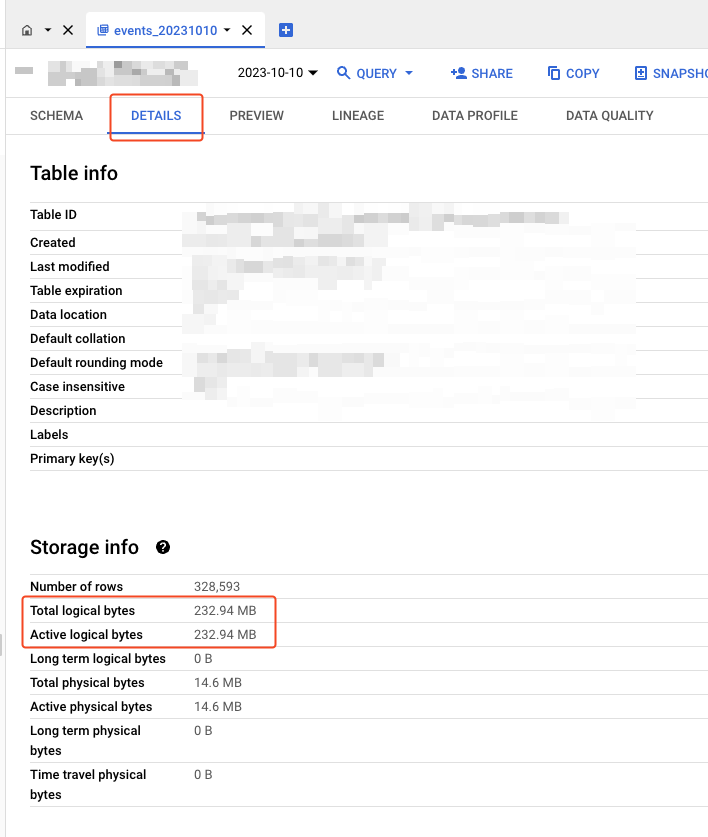
To be honest, unless you receive a lot of data, the storage cost is likely to be low. Moreover, there is no need to keep 10 years of data, so you may want to remove raw data from time to time, so at some point the total size of your data will stop increasing.
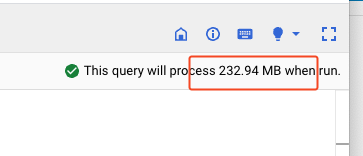
- Query: €5 / TB with 1TB/month being free.
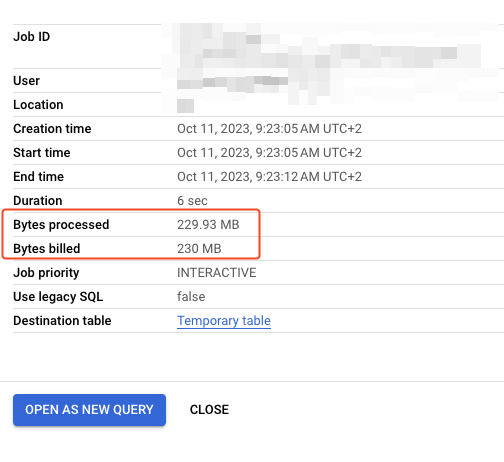
When you query a table in BigQuery, the amount of data processed is highlighted in the screen. This is what is being charged by Google.
If you decide to query your data using a visualization tool such as Looker Studio, you don’t have this information, but you are charged anyway. Under the hood, Looker Studio is generating SQL code and sending them to BigQuery to get the data it needs.
The more graphs you generate, the more expansive your setup will be. Only if you do it the wrong way, though.
How to reduce costs
The wrong way of using GA4 is to connect the raw data directly to Looker Studio and create the reports on it, like you’d do with the GA4 connector. As highlighted above, you’d be querying a lot of data and maybe spending a lot of money.
The trick is to create summary tables from your raw records and incrementally load them to reduce costs by at least 80%.
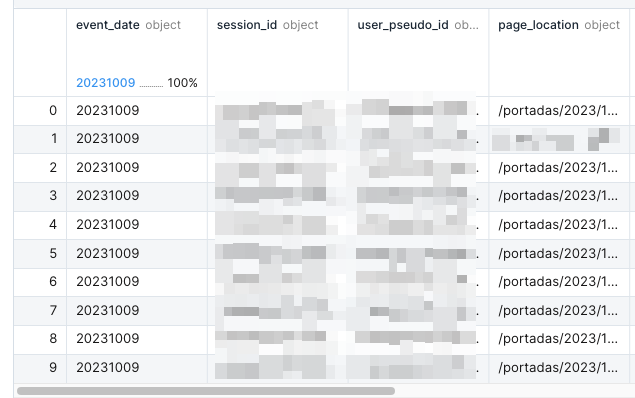
Let me explain. The data sent by GA4 contains a lot of information as you can see below. Some names are not obvious, and I highly recommend taking a moment to look at their definition here.
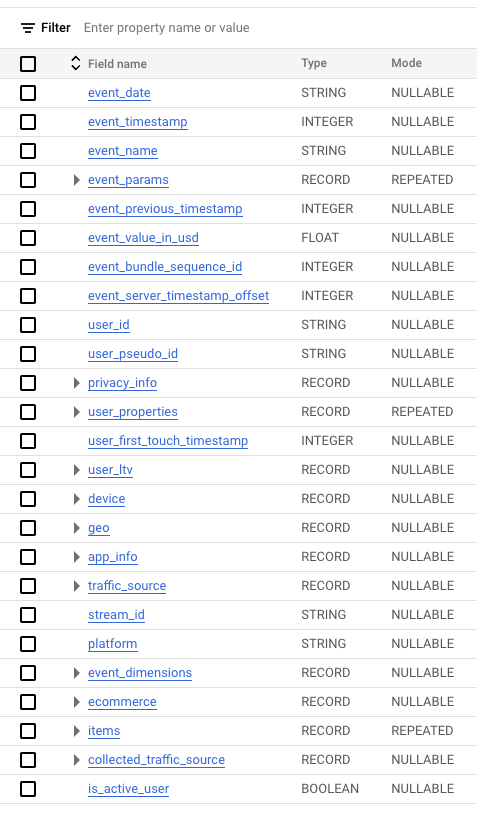
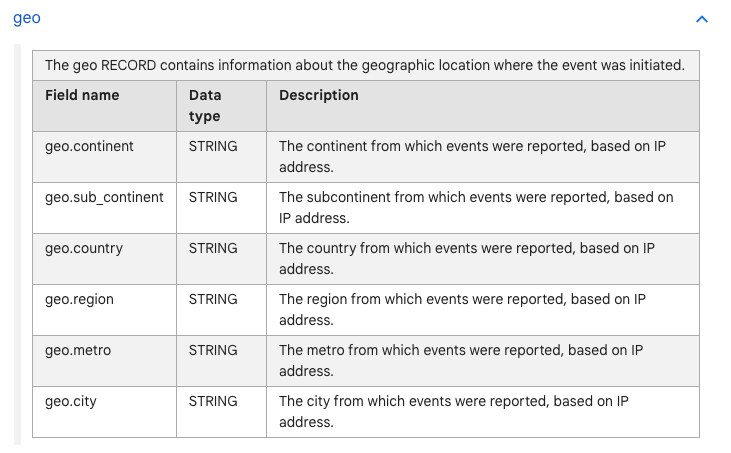
That being said, you often need only a slight portion of this data. For instance, a lot of data is stored around the location of a user (based on the IP used), but I often look at the country and nothing else. It obviously depends on the project, but you get the point.
Step 1: Create the SQL query
To keep only the information you need, you’ll need a bit of SQL. My recommendations:
- Understand the data structure that is being used in the GA4 export. Read the documentation.
- Read my introduction to SQL to get the basics right and get yourself familiar with the UNNEST formula
- Take a look at the code samples provided in this website
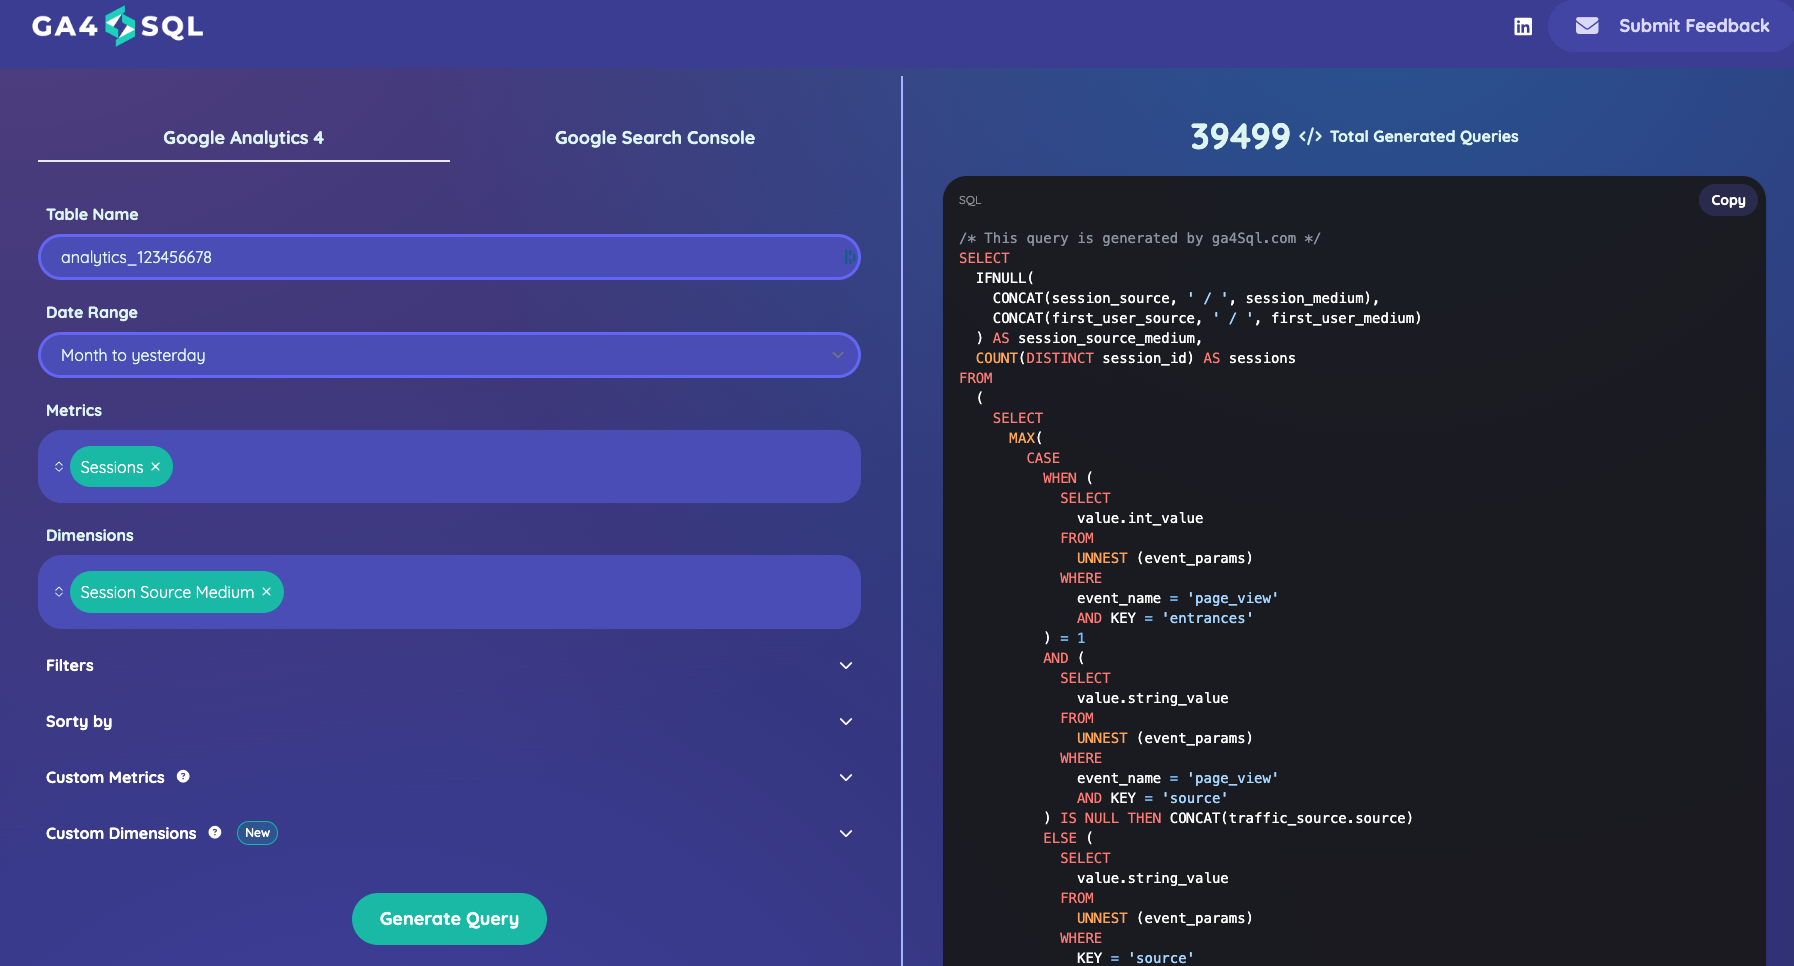
- Use this tool to create the basis for your SQL queries
The last tool is wonderful because it allows you to create ready-to-use SQL queries based on the metrics / dimensions that you need. Be sure to double-check them, though, because based on how you track things, you may need to adapt them slightly.
Don’t be afraid by the length of your SQL query. For the project I’m using an example during this content, the main SQL query is around 300 lines long.
Step 2: Add the columns you may need
Some fields that are available in GA4 are not included in the GA4 export. For instance, you need to calculate the Default Session Grouping based on the medium and the source yourself. Fortunately, you can use the SQL formula used in this page to create this dimension. You can obviously tailor it based on your needs.
And remember, you can apply it retroactively.
Step 3: Implement the incremental load
Once you have these logics defined, you can schedule a job every day to load your data into the summary tables. It can be implemented in a countless number of ways, but the logic I follow is the following:
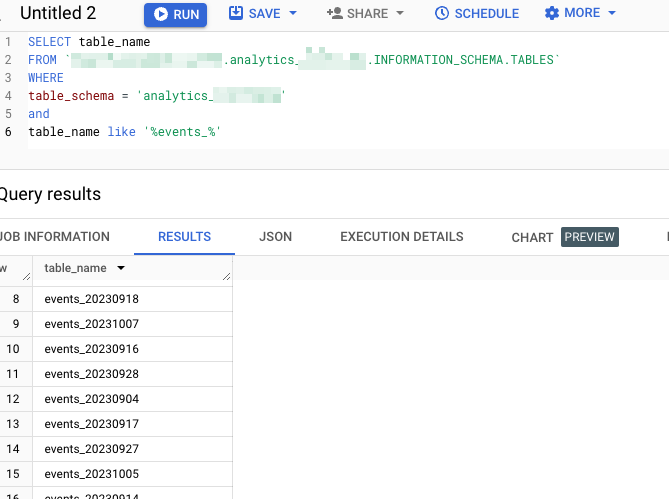
- List the tables included in the export: as explained, GA4 creates a table per day. By listing the table and looking at what is included after the event_, we know what days are available.
- Define the tables that you will process: As we are loading incrementally, we only want to process the tables that are not included in our summary tables. This prevents us from adding twice the data from the same day.
- Run the SQL queries: you’d end up with the data you need to add to your summary tables
- Add it to your summary table
Results:
- Reducing the size of the original table by around 80%. It can be more / less based on your needs.
- Increasing your storage costs (we create another table)
- Decreasing (quite significantly) query costs
As querying costs is harder to forecast (because it depends on usage), I’d rather have this setup to be honest.
What about data visualization?
This is great, but if you don’t know how to write SQL queries, how the heck am I supposed to visualize it? Don’t worry, it is actually super easy !
- Create a new report in Looker Studio
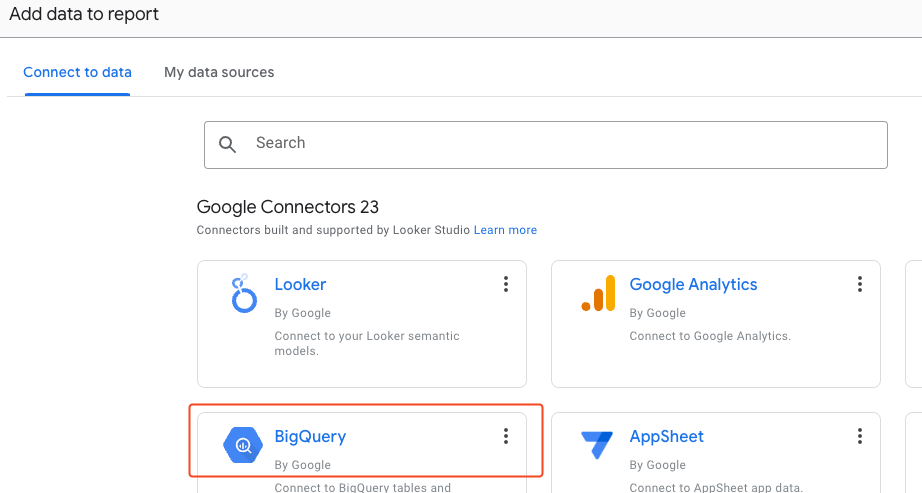
- Select the BigQuery connector
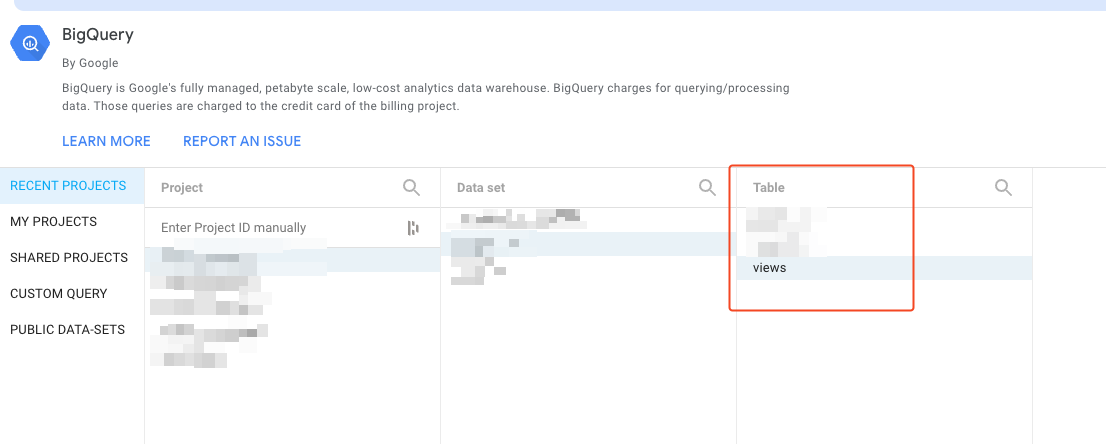
- Select the table you want to use as a data source. Remember to use the summary table, not the raw data.
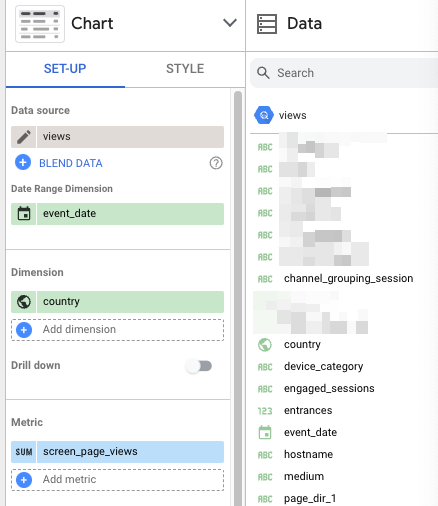
- Enjoy your data. You can now use your data the same way you’d use any other connector.
Final words
I am not going to lie: this setup is quite time-consuming the first time you do it. And I wouldn’t advise it for small projects because it adds too many layers of complexity.
That being said, for projects where data quality and exhaustively is key, it is a no-brainer and doesn’t need to be expensive, unless you are generating a lot of data.