
In a previous article, I explained what you’re not told about the GSC data. Despite what I mentioned, I still believe that GSC is the best dataset you can use for SEO.
In this article, I want to explain in-depth how you can download data from the API from scratch. Indeed, the official documentation can be confusing if that’s the first time you do it, and there is no proper 101 guide.
Google Sheets: Your first interaction with the API
If this is the first time you wish to use the API, I strongly advise you to install this free extension for Google Sheets. If you’re using Excel, take a look at this alternative, even though I’ve never used it.
- Open the extension link on the Google Workspace Marketplace
- Click on Install
- Open a new Google Sheets document (you can use the sheets.new shortcut)
- Click on the Extensions item from the main menu and then on Open Sidebar
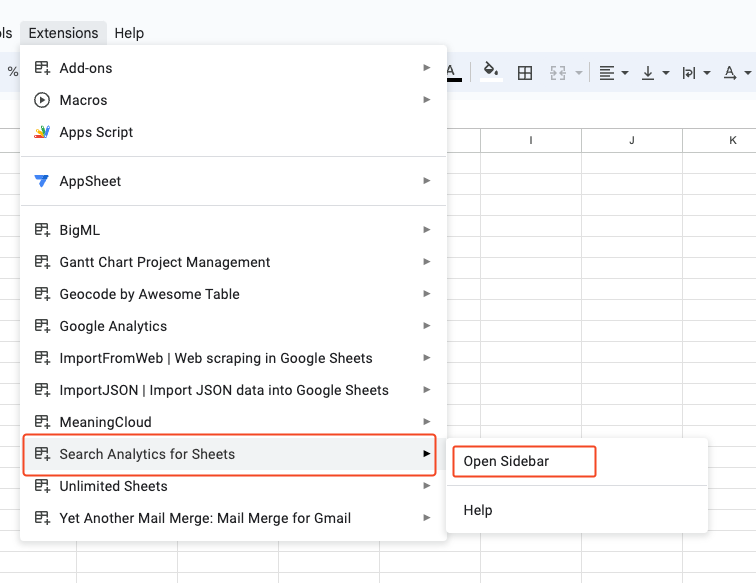
- In the sidebar, you can configure your extraction.
- Verified site: you’ll have access to all the properties your account has access to. Please note that if you are connected with several Google accounts at the same time, you need to use the default one; otherwise the extension will throw an error.
- Date range: by default, the extension will select the widest range (last 16 months) possible.
- Search type: discover, googleNews, news, image, video or web (the default value).
- Group by: indicate here the dimensions you want in your report. The list and what they represent is available here. If you leave this field empty, the API will return a single row with the total number of clicks, impressions, average CTR & position based on your filters.
- Filter by: filters you want to apply to your report. You would like to apply a filter on a dimension, even if it is not included in your group by.
- Rows returned: the free version of the extensions can return up to 25,000 rows, which is the maximum number of rows you can get from the API with one single call. If your complete result has more rows, you’ll get the ones with the highest number of clicks.
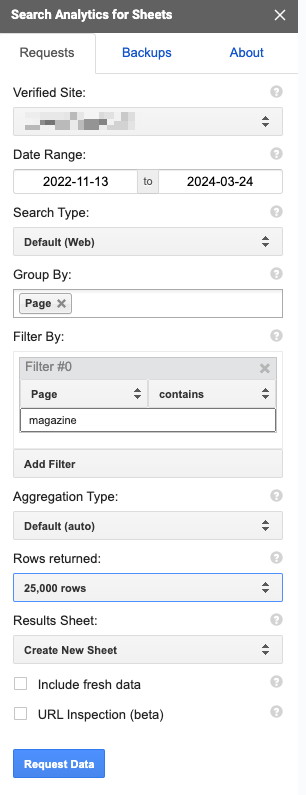
When you click on Request Data and after a couple of seconds, your data is added to a new sheet.
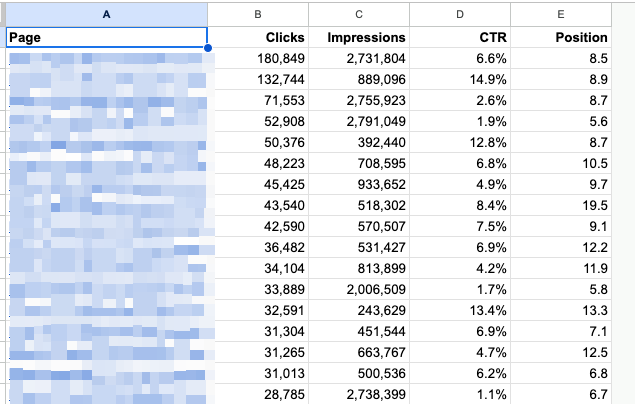
25,000 rows is more than enough to play around with the API and understand how it works, and the easy integration with Google Sheets makes this process straightforward for everyone.
Looker Studio: when 25,000 rows is not enough
You can also use Looker Studio (formerly known as Google Data Studio) to interact with the API directly from one of the most known visualization tools.
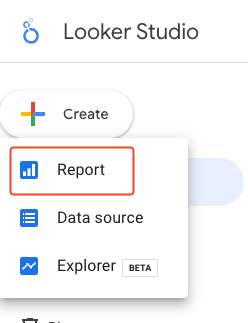
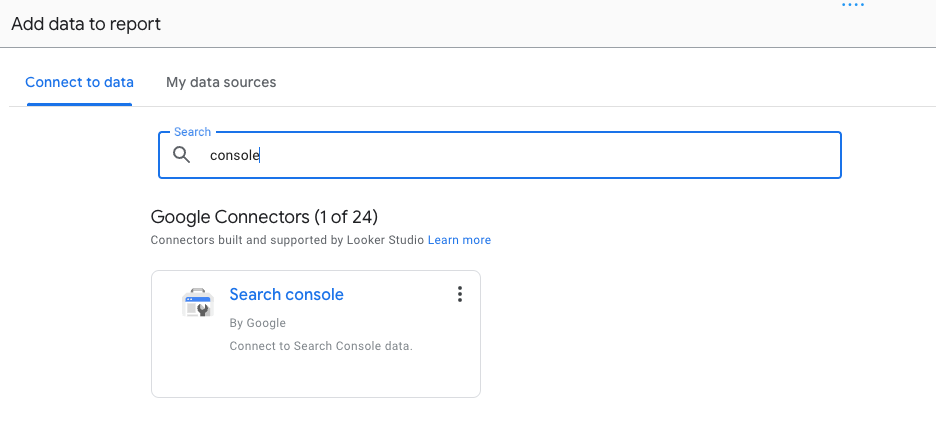
- Open the Looker Studio homepage
- Create a new report
- Select the Search Console connector
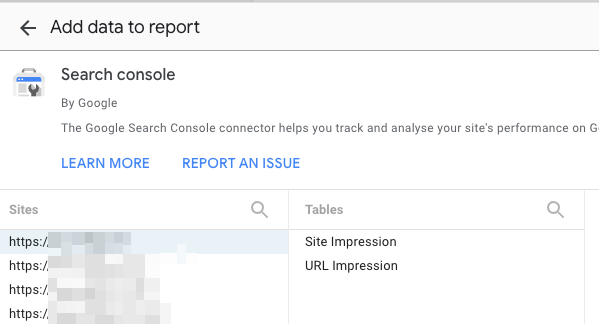
- Select the web property you want data for. Google Search Console uses 2 different aggregation methods for reporting on search performance: site impressions and URL impressions. The Search Console connector provides you with access to both these methods; however, a single data source can only use one of these. For more information on the differences, see here.
- Select the search type
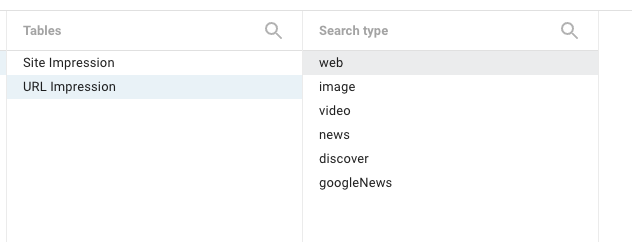
- Click on Add
You can now create simple visualizations using Looker Studio, as you’d do with any data source. Under the hood, Looker Studio will generate API requests and display the results. You can retrieve more than 25,000 rows, as demonstrated by the example below.
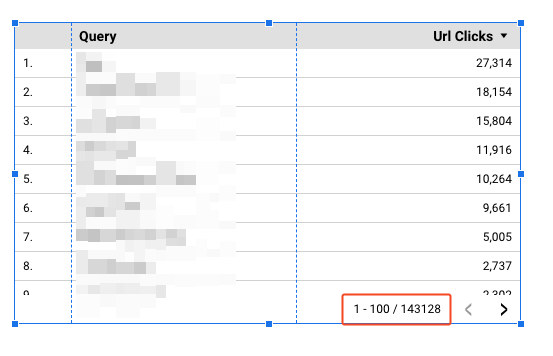
That being said, Looker Studio is wonderful to visualize a trend (for instance) but is very inefficient when it comes to API calls, which will eventually make your dashboard super slow if you request too many data. Moreover, analyzing in-depth data using a dashboard is complicated to say the least, so we cannot rely on this tool to access the data from the API.
How to connect to the GSC API
If you’re not interested in coding, I wouldn’t advise continuing reading this article. While I’m sure there are ways of achieving what I’ll be describing below with a no-code solution, I prefer to do it that way.
All the codes provided will be in Python, but the logic is code-agnostic, and you can adapt it using other programming languages.
STEP 1: Create a project in Google Cloud Platform
Note that if you’re using your professional email, you may not have the rights to perform these operations. I’d suggest speaking to your team to know who can do it for you.
- Open the Google Cloud Console
- Click on the item close to the Google Cloud logo and create a new project
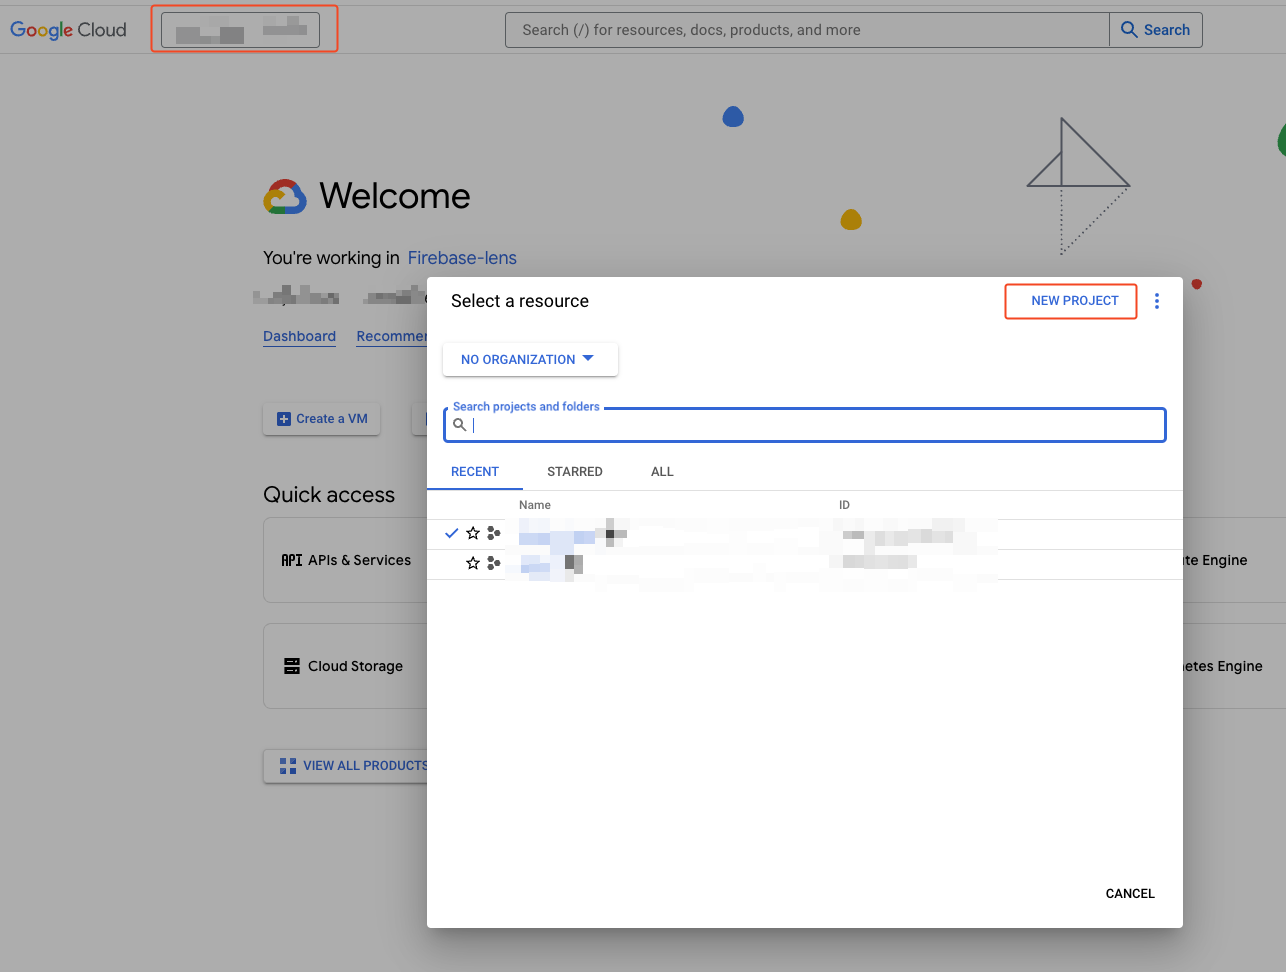
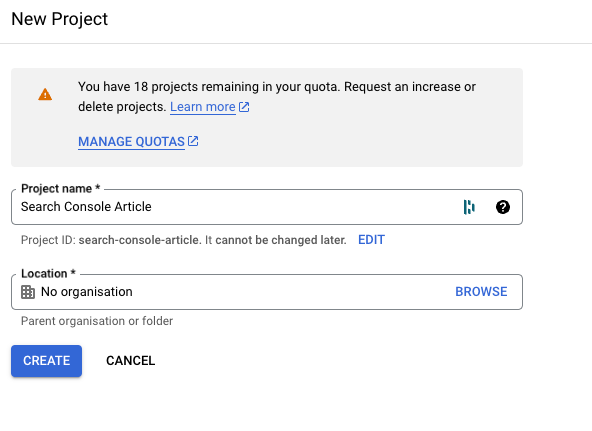
- Give it a name. You can use whatever you want, but try to be descriptive. Then, click on Create. If you like, you can change the ID (used by Google to identify your project). In my case, I’ve decided to use the default name: search-console-article. In a real scenario, do not share this ID. I do it now because the project will be deleted before this article is published. 🙂
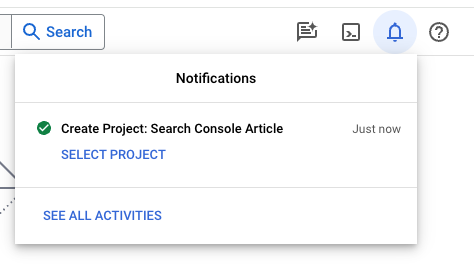
- After a couple of seconds, a notification will appear. Click on select project
STEP 2: Activate the Google Search Console API
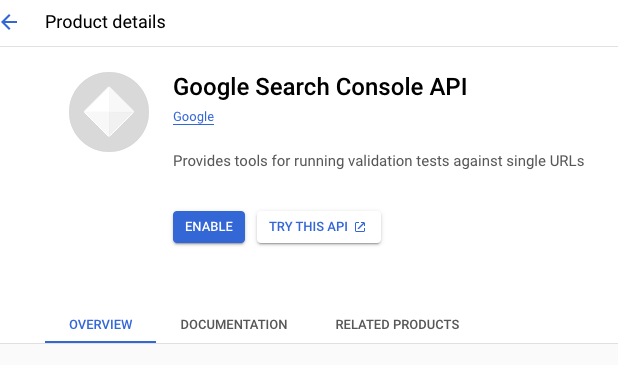
- In the search bar, search for search console and select the Google Search Console API element from the Marketplace.
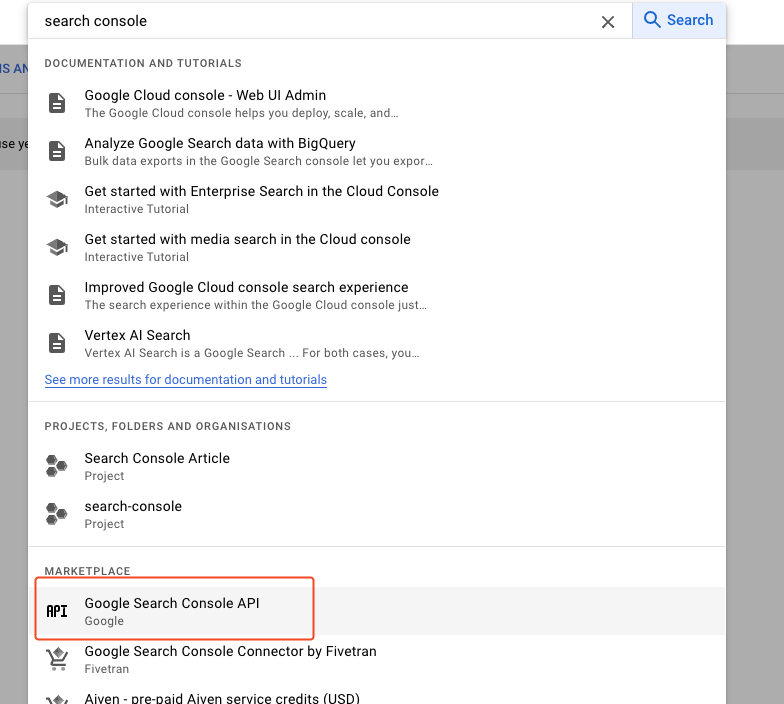
- Click on Enable
STEP 3: Create a service account
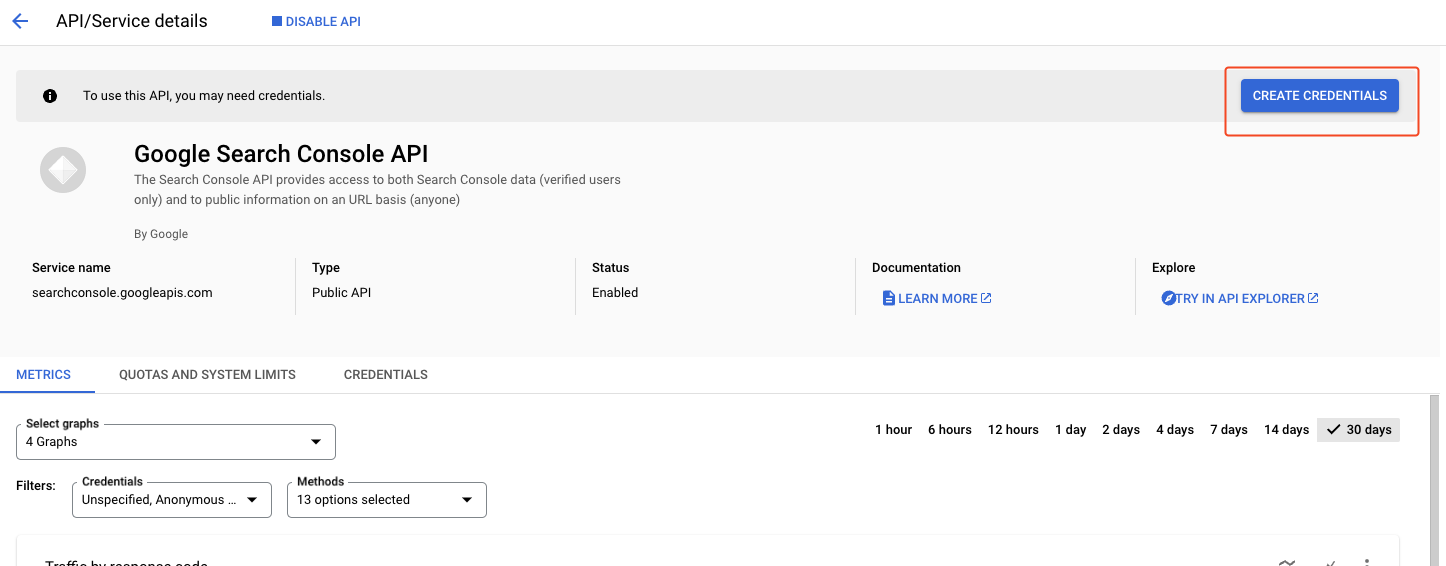
- On the screen that will load after a couple of seconds, click on Create credentials
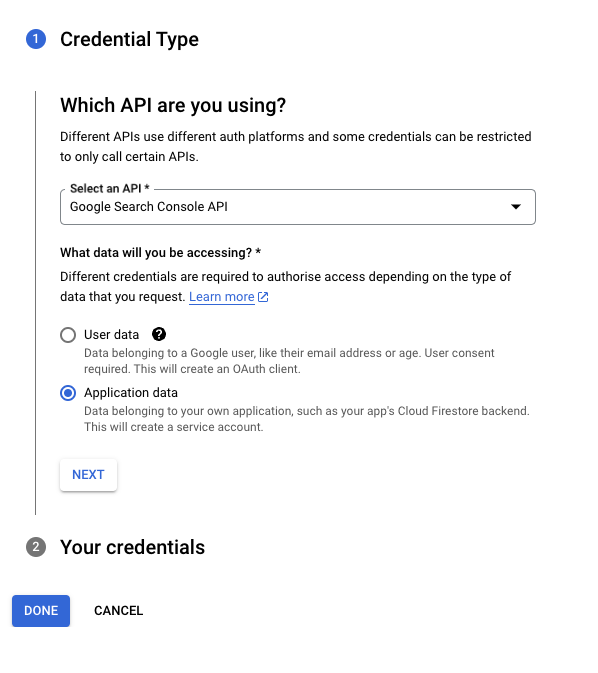
- Select Application data and click on Next
We’ll now move on to create what is called a service account key. If this is a new concept for you: a service account is a special kind of account typically used by an application or compute workload, such as a Compute Engine instance, rather than a person. A service account is identified by its email address, which is unique to the account to make authorized API calls.
There are other ways to access your GSC API, but this is the easiest one, especially if this is the first time you do it.
- Add a name (not mandatory, but I highly suggest it) and an ID and click on Done
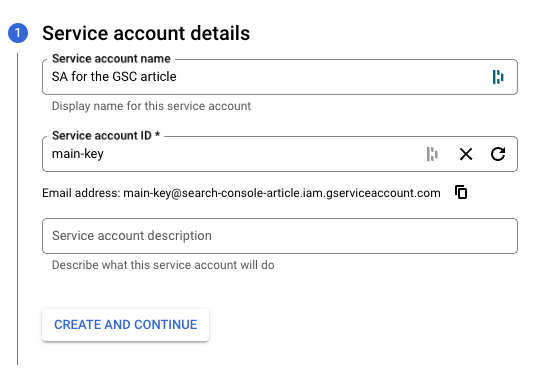
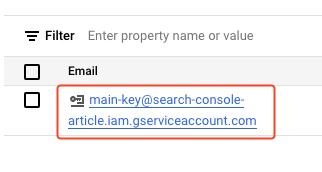
- Copy the e-mail (we’ll need it later) and Click on the e-mail
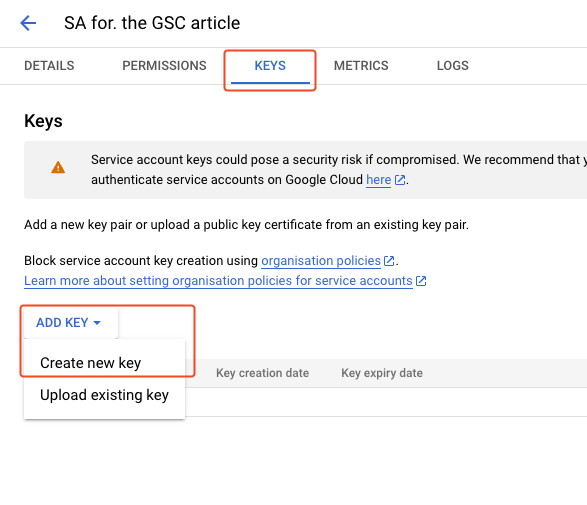
- Select the Keys tab, click on Add key and Create key
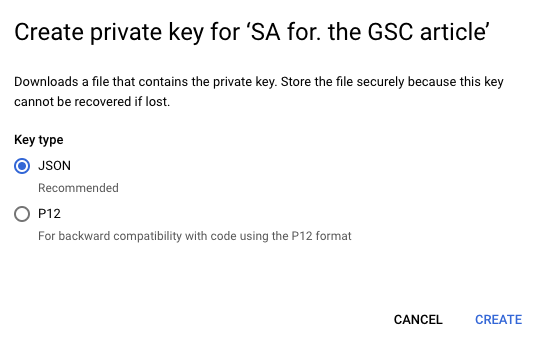
- Click on Create ensuring that JSON is selected. A file will be downloaded to your computer: save it where you can easily find it because we’ll need it later.
STEP 4: Add the service account to your GSC property
- Open Google Search Console
- Select your webproperty
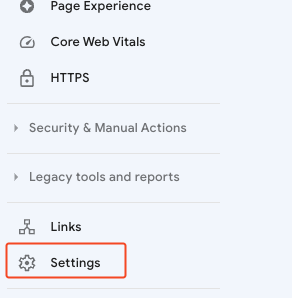
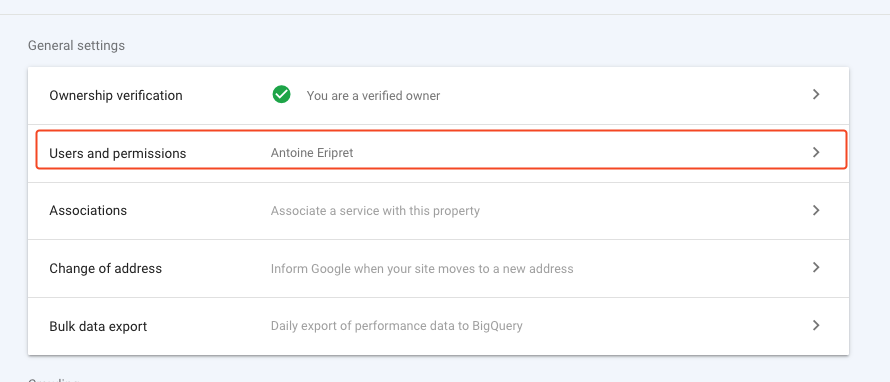
- Click on Settings
- Click on Users and permissions
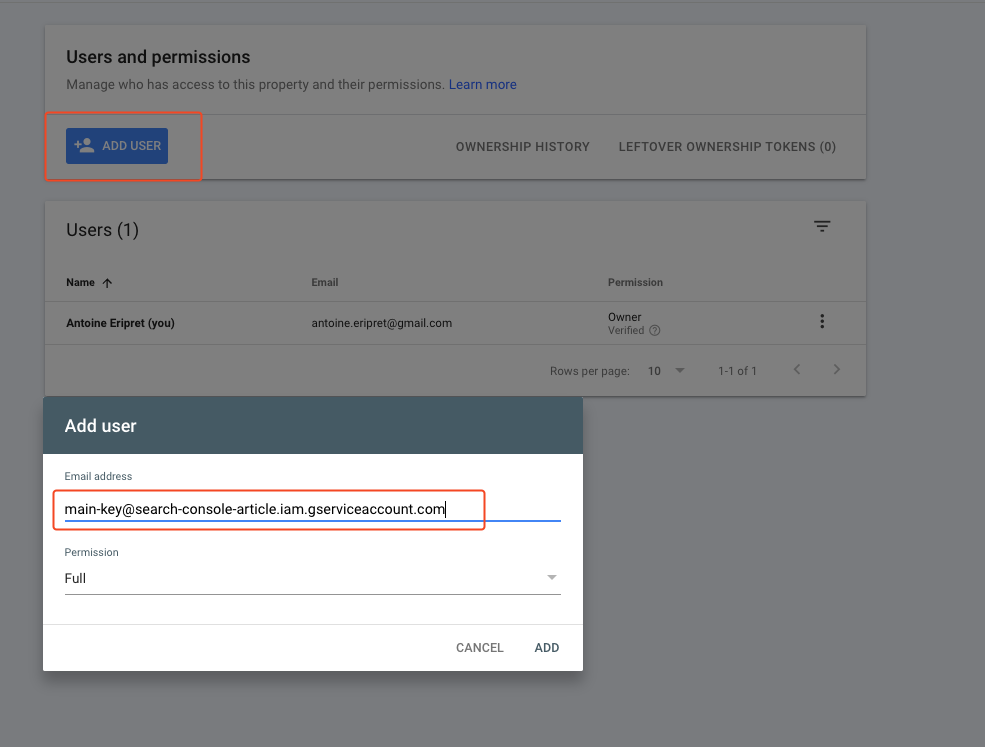
- Click on Add user and add the e-mail you copied in a previous step here. If you do not see the Add user button, it means that you do not have the rights to add new users, and you’ll have to ask someone else to do it. This will often happen if the property is not yours.
STEP 5: Your first API call
We’re almost done! Now, let’s write some code.
As I explained at the beginning of this section, I use Python, and I’ll explain how you can do it using this programming language. But please don’t hesitate to translate the logic into another language if you prefer. To ensure that you can run the code even if it is the first time you use Python, we’ll use Google Colab.
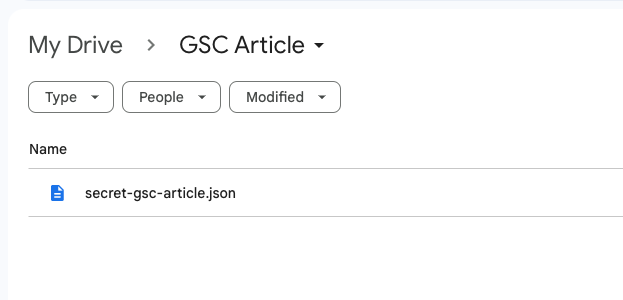
- Create a folder in Google Drive and upload the JSON file you downloaded previously
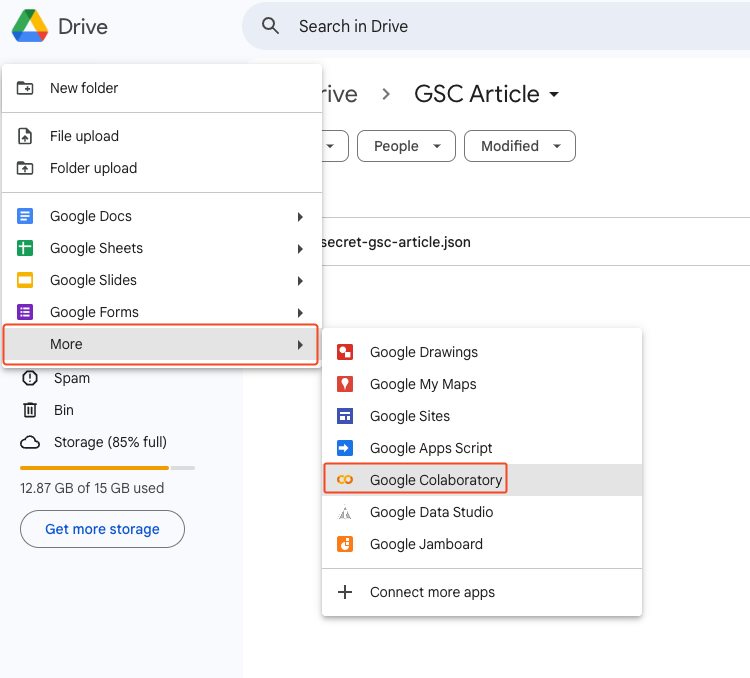
- Click on New and create a Google Colab file
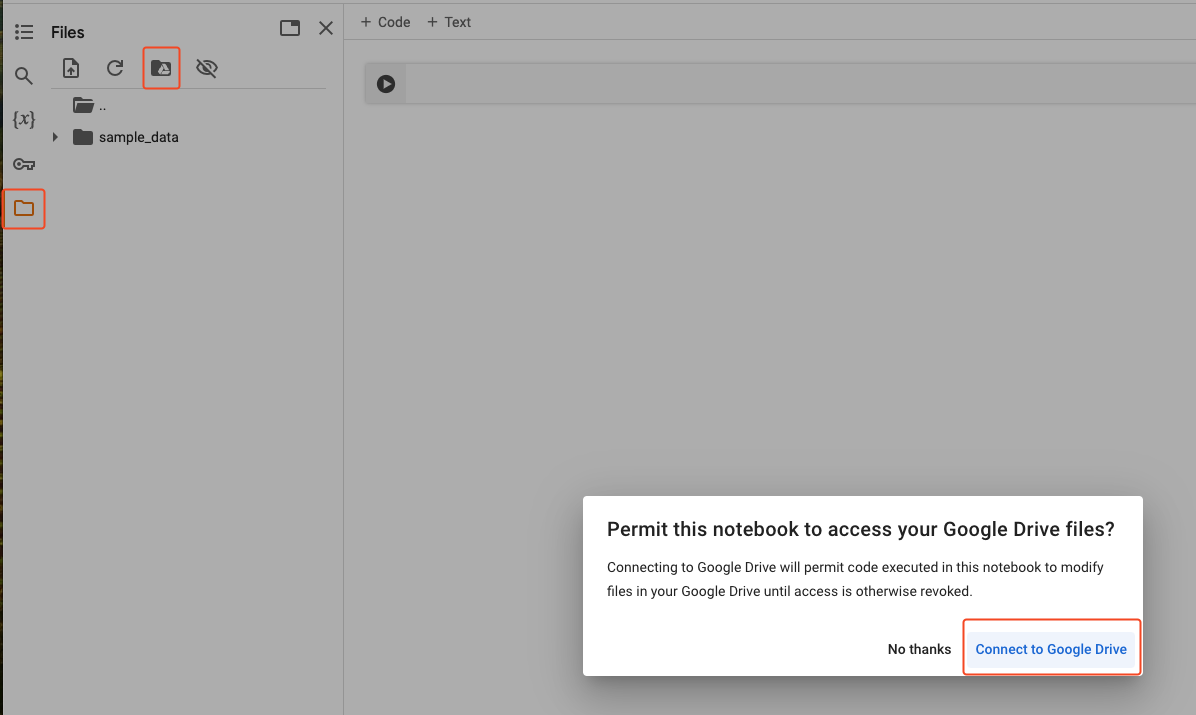
- Click on the folder icon in the lateral menu, then on the folder with the Google Drive icon, and on Connect to Google Drive. This will allow our file to access your Google Drive documents.
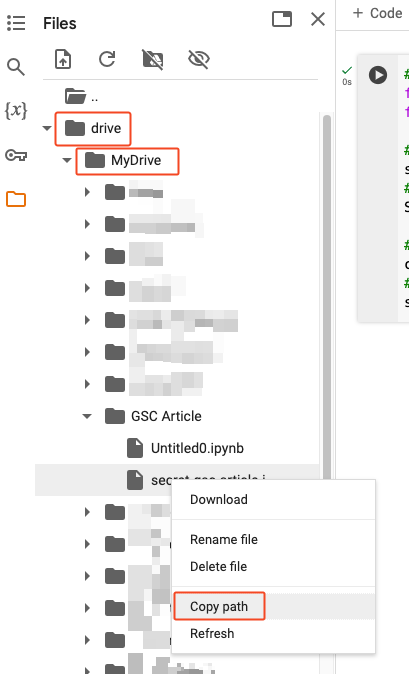
- Search for your file inside drive > MyDrive and copy the path using the right click.
- Copy the following code and run it, updating the path for the secret_file
#import code from Google
from googleapiclient.discovery import build
from oauth2client.service_account import ServiceAccountCredentials

#path to our secret file
#update the path with what you copied
secret_file = '/content/drive/MyDrive/GSC Article/secret-gsc-article.json'
#scope we need to access to GSC API
SCOPES = ['https://www.googleapis.com/auth/webmasters.readonly']

#build the credentials object
credentials = ServiceAccountCredentials.from_json_keyfile_name(secret_file, SCOPES)
#build the service (GSC API)
service = build('webmasters', 'v3', credentials=credentials)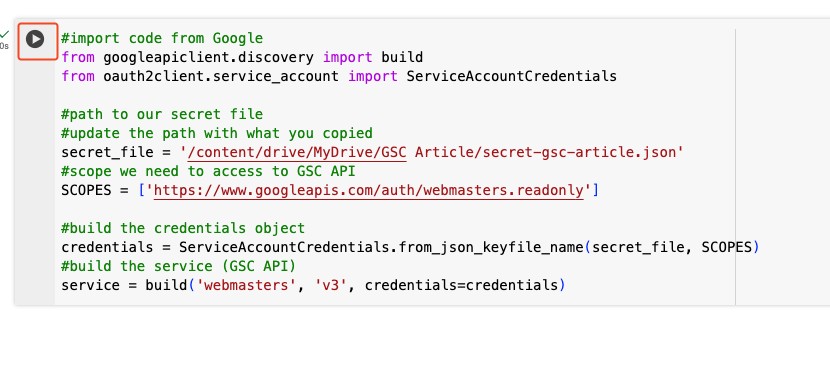
- Run this other cell and ensure that you are getting something as shown below. One common is issue is having a 403 error. In that case, please ensure that you’ve entered correctly your site_url and that your service account has been added to the GSC property.
#update with the URL of your webproperty
#example with one of my domains
#if you have a domain property, the structure would be sc-domain:comoescribir.net
site_url = 'https://www.comoescribir.net/'
#YYYY-MM-DD format
start_date = '2024-01-01'
end_date = '2024-01-31'
row_limit = '1000'
request = {
    'startDate': start_date,
    'endDate': end_date,
    'dimensions': ['date'],
    'rowLimit': row_limit
}
response = service.searchanalytics().query(siteUrl=site_url, body=request).execute()
response 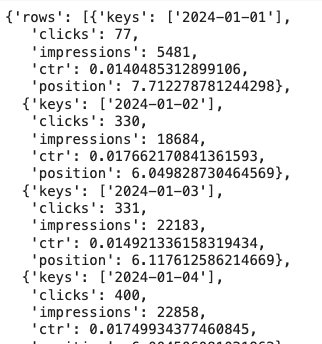
Awesome, you can now access your data through the API. Nevertheless, we’ve just retrieved 1000 rows, which is obviously not what we wanted. Let’s continue this tutorial by understanding better how the API works under the hood before writing the code to retrieve a higher number of rows.
How can we retrieve everything from the API?
How does the API work
As we’ve seen, a simple API call needs to be built using a request object with the following information. There are more parameters available, but we’ll keep things simple for this article.
request = {
'startDate': start_date,
'endDate': end_date,
'dimensions': ['date','page'],
'rowLimit': 25000
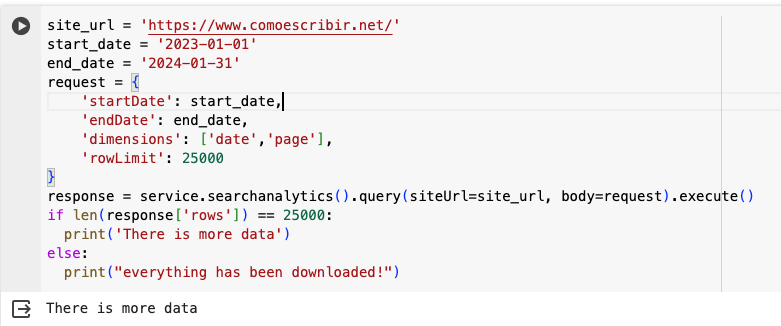
}By default, the API will return only 1000 rows, and you can enforce a higher limit (up to 25000 rows by call) using the rowLimit parameter. It doesn’t mean that you can only retrieve 25,000 rows, but you’ll need to make several calls to do so.
If you run the previous code, and you have 25,000 rows in the response, it means that there is still data you can download. As you can see, by requesting the date & page dimensions for a long time range, one call is not enough.
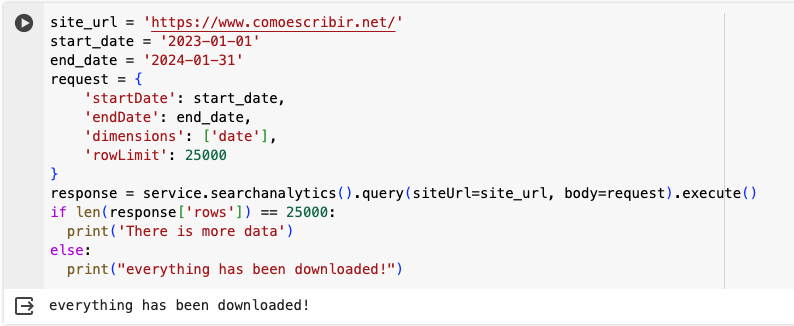
But if I just request the data per date, 25,000 is more than enough, and I can get everything in one call.
If you know that there is still data to download, you can use the startRow parameter to download what we can refer to the second batch of data. Let’s use an example.
For this project, there are roughly 50,000 indexable URLs. So let’s try to see how many pages have triggered at least one impression. The first call is similar to what we’ve seen before, but I added the startRow parameter.
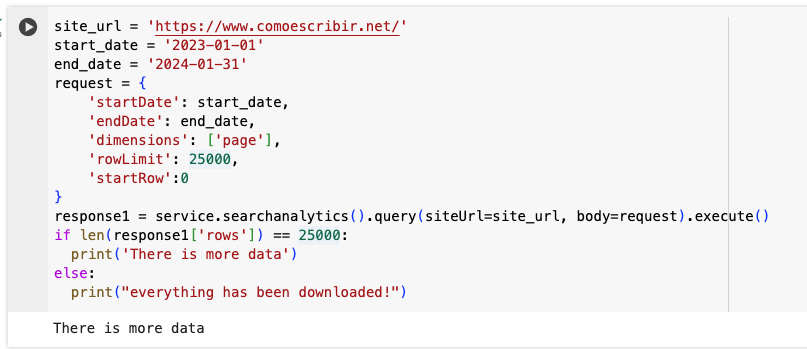
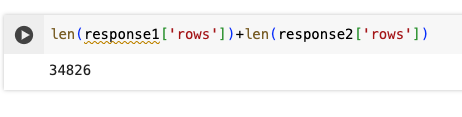
This triggers the There is more data statement, which makes sense. Now let’s continue by making a second call. As you can see, I added, 25000 to the value of startRow.
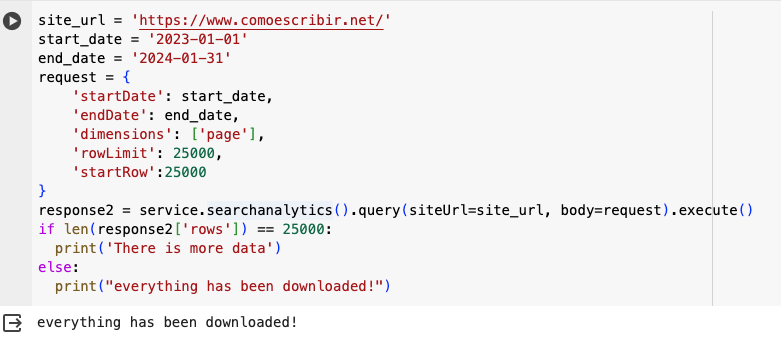
Everything has now been downloaded, and I retrieved a total of 34,828 rows. Awesome, right?
Updating requests manually to retrieve everything is obviously not what you want because it’d be time-consuming, so you can use this updated code to generate calls until everything is downloaded.
site_url = 'https://www.comoescribir.net/'
start_date = '2023-01-01'
end_date = '2024-01-31'
#our initial requests
request = {
'startDate': start_date,
'endDate': end_date,
'dimensions': ['page'],
'rowLimit': 25000,
'startRow':0
}
#where we'll store our downloaded data
full_response = []
#variable we need to make our while loop work
is_complete = False
while not is_complete:
#our call
response = service.searchanalytics().query(siteUrl=site_url, body=request).execute()
#we update our request for the next requet if needed
request['startRow']+=25000
#if we have more than 25000 (no more data), we update the variable value
if len(response['rows'])<25000:
is_complete = True
#we append our data
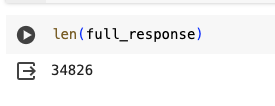
full_response.extend(response['rows'])Which has the same number of rows returned, obviously, but without having to manually edit our code every time we run a request.
This code will allow you to download all the data available in the API with (theoretically) no limit. I have read more than once that the API has a limit of 50,000 rows, and I honestly don’t know where this statement comes from. I’ve, more than once, run API reports with millions of rows being returned (with several API calls being made, obviously).
How to analyze the data
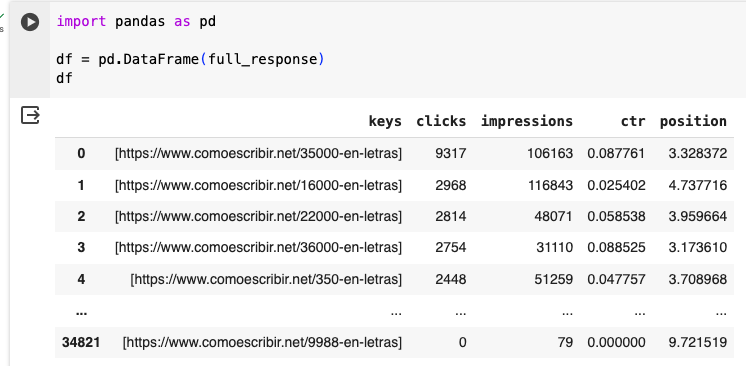
As we’ve seen below, the API returns data as a list of dictionaries, which is quite common but not ideal if you want to crunch data.
You can easily transform this data into a table-like format using a library called Pandas. This library is one of the most used to analyze data in Python and will allow you to perform any operation Excel could. I won’t explain what you can do with this library in this article, but if you’re interested, I highly suggest that you buy this book.
For advanced users: my GSC library
Once you’ve understood how the API works and if you’re using Python, I strongly advise taking a look at my GSC library. It has been designed to accelerate the process of what has been described in this article.
Learn Pandas first (at least the basics); otherwise you’d have a hard time using it. Please note that the library can work with BigQuery export as well, but I won’t explain here.
Install the library
Just run the following code in Google Colab:
!pip3 install git+https://github.com/antoineeripret/gsc_wrapperThis may take a moment because the library relies on several dependencies that need to be updated.
Connect to your GSC account
Using the service account JSON you downloaded earlier, you can access to your data easily.
import gscwrapper
account = (
gscwrapper.
generate_auth(
client_config="/content/drive/MyDrive/GSC Article/secret-gsc-article.json",
service_account_auth=True
)
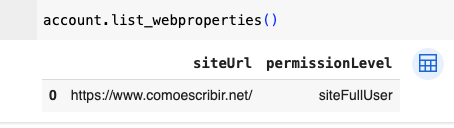
)You can easily check what properties the service account has access to using the following code:
Download data
Even if under the hood the code is similar, you can use a simpler syntax to retrieve what we’ve seen before. Take a look at the documentation to understand how you can generate more complex queries including filters, for instance. Our previous queries would be built like this:
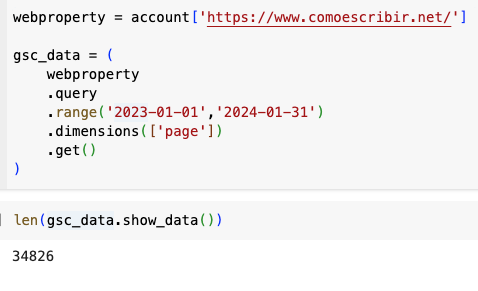
webproperty = account['https://www.comoescribir.net/']

gsc_data = (
    webproperty
    .query
    .range('2023-01-01','2024-01-31')
    .dimensions(['page'])
    .get()
)
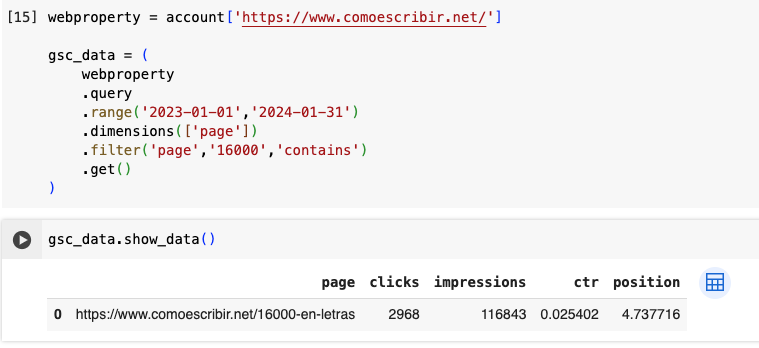
Adding filters is simplified to allow you to play easily with your data.
Analyzing your data
A large list of methods is available to apply to your data. One of the simplest – but that I often use – allows you to group data by month for instance,
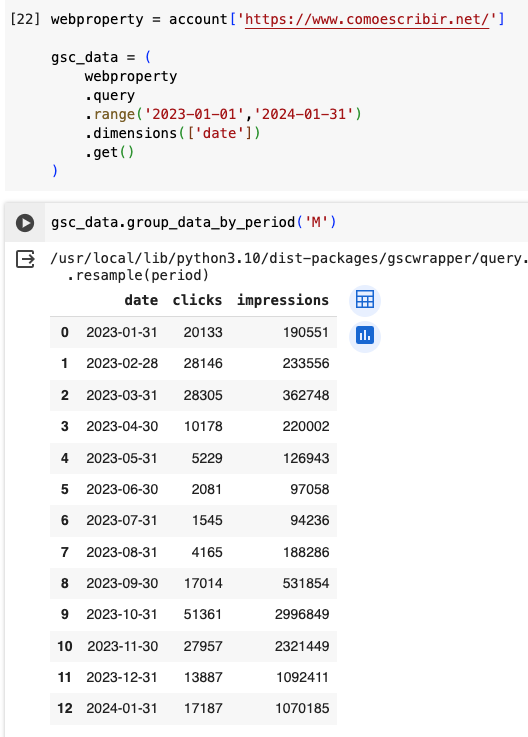
This will dramatically improve your workflow. If you encounter any issue or suggestions to improve it, please leave a comment on GitHub.