
If you’re working in digital marketing, you must be well aware that Google decided to sunset one of their most used analytical tools: Universal Google Analytics (GA3). Even if you have a 360 account, you should have ended your migration some months ago and stopped using this product.
The new version (GA4) does not consist of a simple UI change and the first experience can be frustrating, as simple reports can be challenging to create and default graphs often don’t make sense. Therefore, how can we use GA4 without losing our minds?
A little bit of background: GA3 vs GA4
GA3 was a wonderful product because it was simple to use, even for newbies. But it suffered from major flaws:
- An outdated data model. Events needed to be categorized using action, label & category which often created a mess. Moreover, the number of custom dimensions we could create was limited.
- A complex integration with other data sources. Syncing raw data with other data sources was doable (source) but was released late. Using the API to do it ourselves is not an option because the number of dimensions we could request was limited.
- A complex monetization. Google is a profit-driven organization, and the tool was hardly monetized. They needed to create a product designed for big spenders.
The new GA4 has flaws, but it solves these issues:
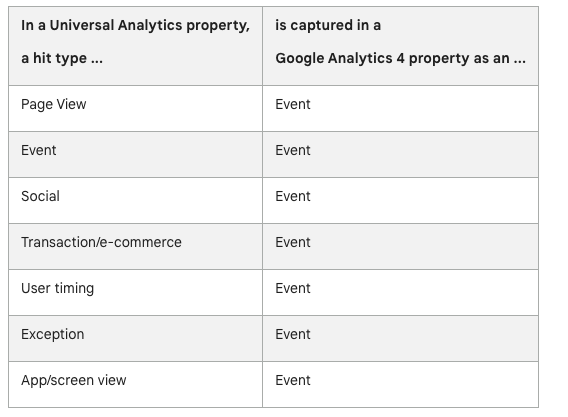
- The data model is more flexible. Everything is an event, and you can create custom parameters using your own classification. You can, for instance, create a login event with a custom parameter called method to understand if your users are using their e-mail or the Google / Apple / Facebook connectors. This was doable with GA3, but messier. This flexibility is what, IMO, makes the whole UI difficult to use.
- You can easily sync data with BigQuery, which eases the integration with other data sources for an ELT/ETL.
- For the same reason and because the UI is challenging to use, the tool can now be monetized through BigQuery. I’m an example: I had never paid to use GA3 (directly or indirectly), I already have for GA4.
I won’t enter into too many details, but my point is that GA4 is objectively a better product for advanced users. For SMEs, I’d strongly advise using simpler tools because the learning curve is too steep. You may have to rely on a monthly subscription, but I’d rather spend €10 per month than spending hours learning how to use a tool whose main features I won’t use.
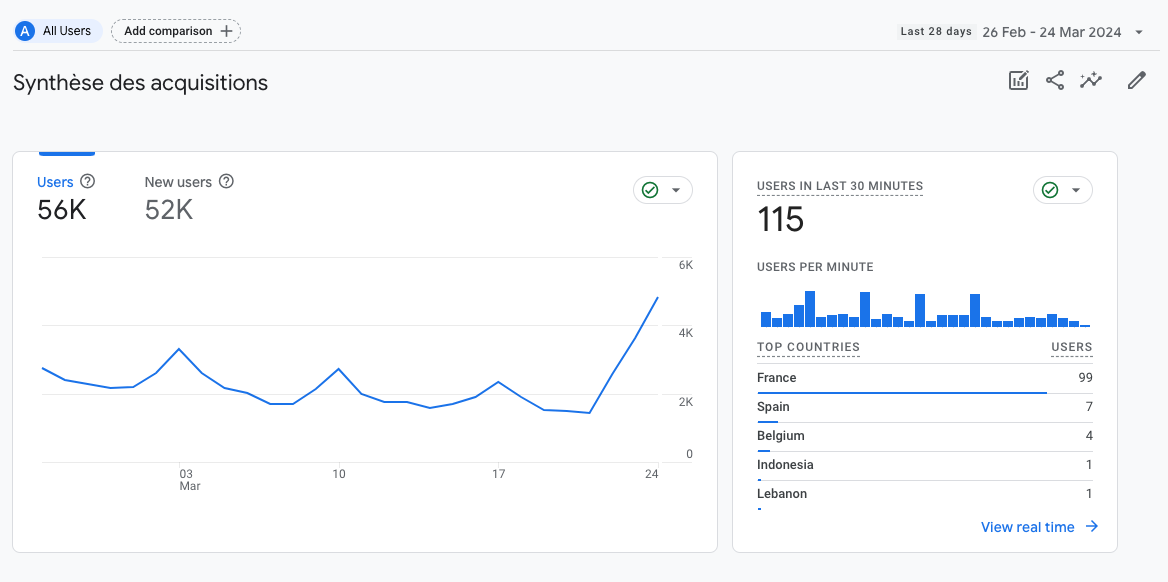
If the UI is challenging to use: how can I use GA4 to track my KPIs?
If you use GA4, my first advice would be to stop thinking about GA4 as a tool which provides a UI to track your KPIs. GA4 is a back-end tool for your analytics. You need to use it as such.
If you pay close attention to the critics, they can be classified into a couple of categories:
- The UI sucks. Which is not an issue if you don’t use it!
- The data is sometimes inconsistent. You can still have some inconsistencies in the BigQuery export, but less. In the UI, this is often caused by cardinality.
- The data is not accurate. In countries where GDPR (or equivalent) exists, the consent status will impact the amount of data shared with GA. Google came up with a solution: modeled data, which is a black-box to estimate the missing data. In BigQuery, only a couple of fields would be hidden (user_pseudo_id and ga_session_id) which improves the data quality.
So the issue is not GA4 itself, but instead the UI. Which won’t impact us if we don’t use it !
STEP 1: Activate the BigQuery sync
Read this post on the topic. The sooner, the better, Indeed, the sync is not retroactive, hence if you activate it today, you won’t recover your historical data, even if you have been using GA4 for a couple of years already.
In terms of costs to store the data and unless your property is generating a high number of events, costs are very likely to be insignificant.
STEP 2: Define the KPIs you need for reporting
GA4 tracks plenty of events (and linked parameters) but you often won’t even need 20% of them. First, take a look at the data schema to understand the data that you are looking at. A couple of examples:
- Every event has a user_pseudo_id parameters. The definition is ambiguous: The pseudonymous id (e.g., app instance ID) for the user. Despite the name, this field identifies a device, and not a user.
- If you want to get the source/medium of a session, you cannot use the traffic_source.source and traffic_source.medium because these refer to the source/medium that first acquired a user (based on the user_pseudo_id dimension), and not a session.
- Landing pages are not identified as such, they are identified by the page_view event when the entrances parameter is equal to 1.
Understanding these concepts is key to defining what you can and can’t report on. As a rule of thumbs: any information in the UI is doable in BigQuery, you just have to reverse engineer the logic (or use your own).
At the end, you should end up with a list of KPIs such as number of page views, number of sales … and a list of dimensions. Don’t worry if your list is incomplete: one of the main advantages of BigQuery is that you can reprocess data easily to add new KPIs for instance.
STEP 3: Time to write SQL
I’ve written a simple article on SQL for SEO in the past. You’re very likely to have with more complex SQL here.
- Check this website out. You can easily find plenty of pre-existing SQL queries for the most common operations.
- This website will also help you build your SQL queries. A custom GPT (using the same name) is available. It has been trained on the GA4 documentation and will significantly decrease the time you need to create your SQL code.
Do not hesitate to run your code in BigQuery to check that the output is what you needed. For instance, this code would return the revenue by source/medium for the 23/03/2024.
SELECT
traffic_source.medium,
traffic_source.source,
ROUND(SUM(ecommerce.purchase_revenue),2) as revenue
-- update here with your dataset
FROM `project.dataaset.events_20240323`
where event_name in ('purchase')
group by medium, source
order by revenue desc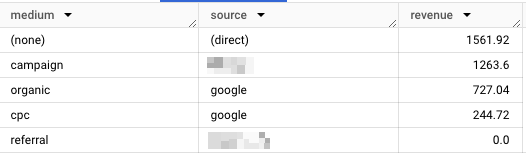
Do not rush this part of the process because a flaw in your logic could impact your assessment of the business situation. One thing I’d like to highlight: BigQuery has a window function you can use to easilty return some values. For instance, the exit page can be defined as the page_location for the last page_view event for a given session (based on the ga_session_id).
session_window AS (
    -- session_id allows to identify sessions
    PARTITION BY session_id
    -- we order data by event_timestamp to have a chronlogical
    -- representation of a session
    ORDER BY event_timestamp
    ROWS BETWEEN UNBOUNDED PRECEDING AND UNBOUNDED FOLLOWING
)
You can then use the FIRST_VALUE() and LAST_VALUE() to easily retrieve the information that you need.
FIRST_VALUE(page_location) OVER(session_window) AS landing_page,
net.Host(FIRST_VALUE(page_location) OVER(session_window)) as landing_hostname,
LAST_VALUE(page_location) OVER(session_window) AS exit_page,
STEP 4: Schedule the extraction
Once you have the code up and running for one day, you need to apply it to your historical data and schedule it for the future. There are several ways of doing so, but I strongly advise using DBT.
This is a data transformation tool that allows you to transform data in a cloud analytical warehouse. In plain English, DBT will handle the following:
- Connect to your GA4 data in BigQuery using a service account file. This page explains how to create one.
- Apply some transformation using the SQL code you’ve created in the previous step
- Create new tables that we’ll use for reporting
I cannot explain in-depth how DBT works, but will try to explain the main concepts. If you need to learn how to use it yourself, I strongly advise buying this course or watching this serie of videos.
- First, create a YML file with the information on the source you need to use. In most cases, your file should look like this:
version: 2

sources:
  - name: google_analytics
    description: "Google Analytics 4 export"
    database: your-project-id
    schema: analytics_xxxxxxxx
    tables:
      - name: events
        identifier: events_*
        loaded_at_field: "parse_timestamp(_table_suffix, '%Y%m%d')"
description: Main events table exported by GA4. Sharded by date.- Then, create a series of SQL files that the tool will use to create tables in BigQuery. The tool handles incremental models, which means that it will run the code only on new data and append the results to an existing table. To improve costs, you can also partition your data by day without having to set up anything in BigQuery.
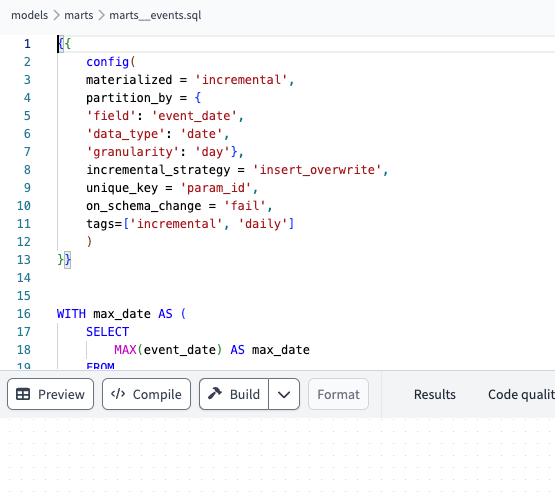
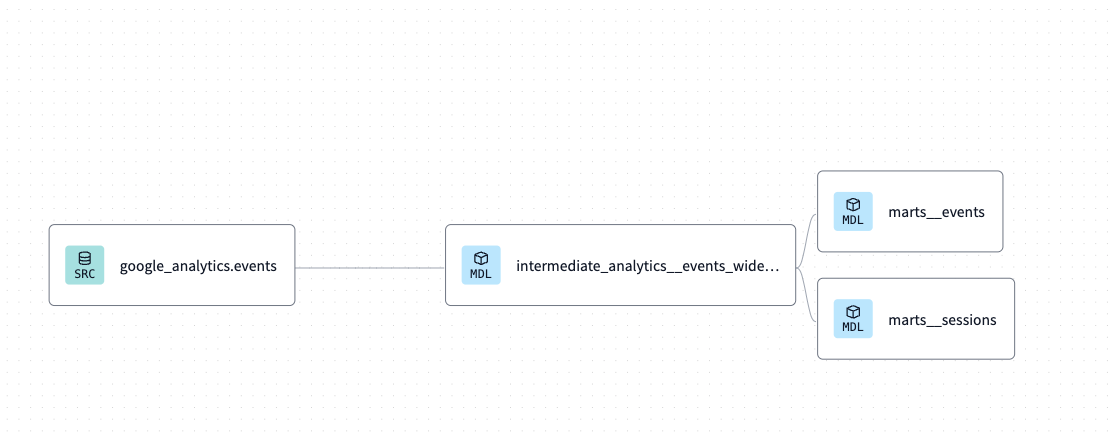
- These models are compiled and run together. In this example, I have a google_analytics.events (my raw GA4 export) used to create a table called intermediate_analytics__events_wide, which is then used to create two tables: marts__events and marts_sessions. Obviously, this lineage can be simpler or more complex, based on your project.
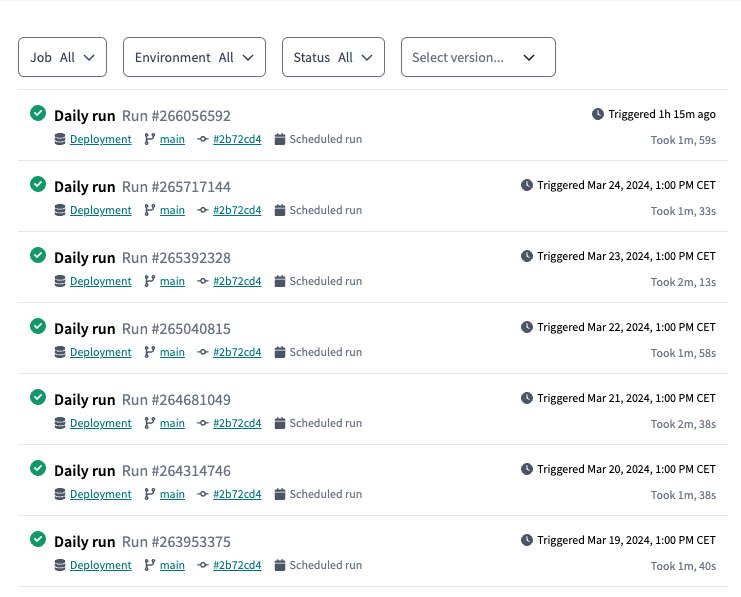
These models are triggered from an online environment, and once you define the execution frequency, you do not have anything to do.
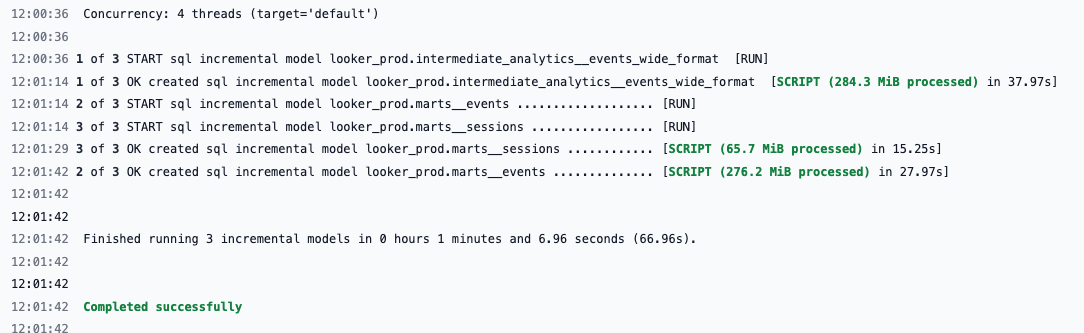
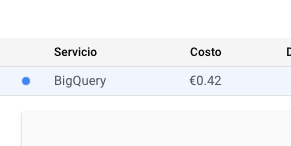
These executions are not free because BigQuery charges around €5 per TB processed. As you can see in my example, these models consume around 600MB per execution, hence ending up representing €0.1 per month, which is obviously super low.
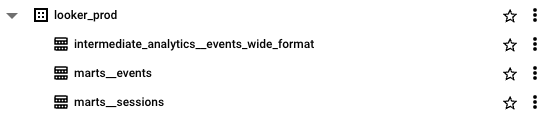
After executing everything, you should see new tables in BigQuery with the information you need! This is not a simple process the first time you do it, but it’s worth it !
STEP 5: Create your reports
Once you have these tables, you can create a simple Looker Studio dashboard using these tables instead of the native GA4 connectors. If you come from a simple GA4 report, you’ll very likely notice a significant decrease in loading speed, which is another benefit of using BigQuery.
The cost of using this implementation will likely depend on how you design the full process and how often your dashboard is used within your organization. But note that for a project with around 1.5M page views per month, the current cost is below 1€/month (for storing and visualizing the data) for March 2024.
For (very) advanced analysis, you can still rely on custom SQL. Very handy to check that the transactions recorded in GA4 and in your E-commerce backend (WooCommerce for instance) match, and you don’t have any discrepancies.
For the rest, Looker Studio will do the trick!